
Both Locally Onsite and Remotely
One of the stations we have in our market broadcasts to listeners using a Nautel NV40 transmitter. (Editor’s note: the NV Series was a predecessor to the current GV Series.) The station, call letters WWDE, has long been a successful radio station in the Norfolk/Virginia Beach market that consistently sustains the most listeners on a daily basis.
With that in mind, the NV40 transmitter is the main transmitter that broadcasts the signal. We have a backup transmitter that is there just in case there is a need to switch if an emergency arises. Because of the reliability of the Nautel transmitter though, it is not often that this occurs. The transmitter itself is equipped with Nautel’s unique Advanced User Interface (AUI) display and software which has proven to be one of the best troubleshooting aids both locally onsite and remotely.
“Overall, the AUI has been a very useful tool both onsite and remotely; whether it is a quick check on the status of the transmitter or turning off the transmitter remotely for tower maintenance. The AUI is the backbone of information from the transmitter to the user and the Nautel AUI has one of the best interfaces so far out of any others I have encountered.”– Shawn Ferguson, Engineer
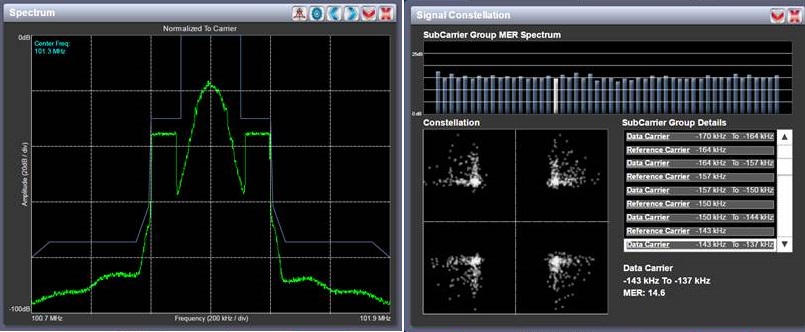
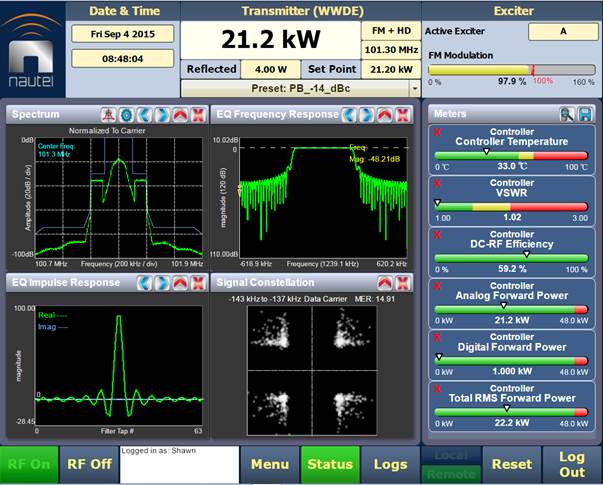
Onsite, looking at the 17” AUI display on the transmitter, it offers enough space to offer a satisfying experience to the user. Some of the benefits the display offers is obviously the date and time, transmitter frequency, and of course power out. But one of the important features of the AUI is the displaying of meters and graphs. The spectrum graph is the most important, (as it should be to any radio station with analog and HD output), as it provides an overall graph of the transmitters performance in relation to the mask. As an engineer, this is one of the first meters I look at when entering the transmitter building. One thing you don’t want is to go out of mask! The signal constellation is another graph that is frequently looked at as well.
Another feature that is beneficial is the ability to fully customize the AUI screen. You can add meter readings to the side of the screen as well as graphs. I have the most important readings on my list such as analog and digital power, total RMS power out, DC-RF efficiency, controller VSWR, PA current, and controller temperature.
The controller temperature meter has been a lifesaver. For a couple of months the temperature was slowly rising. We would take a trip to the transmitter and find nothing out of the ordinary with it. After the reading was on the borderline of the caution zone, we took one more look at the filters on the transmitter. Though they weren’t extremely dirty, it was just enough that the transmitter was getting warmer. After replacing them, the controller temp went down, but without that meter reading, we would not have known that the filters were minutely dirty.
Another great feature is being able to access the AUI remotely via a web interface. Once I log in with my user name and password, it is just like I am onsite. While I wish I could toggle between local and remote, it is understandable why that is not practical or safe from a remote connection standpoint.
If there is anything that is challenging, yet totally out of our control, it would be the connection to the transmitter site. Though there hasn’t been a complete T1 failure in a long time (knock on wood), that is the greatest concern regarding accessing the AUI remotely.
Shawn Ferguson
Engineer, WWDE
Virginia Beach, VA, USA